Network working mode

The Network working mode allows you to discover and see the topology of your network.
The Network perspective only works in API operating mode. Radio modules in AT (transparent) mode do not support the network discovery process.
Network toolbar
The Network toolbar presents the network actions you can perform.
| Button | Name | Description |
|---|---|---|

|
Start scan | Scans the radio module's network and displays a list of available modules. |

|
Stop scan |
When scans specified in scan preferences are finished, the discovery process stops automatically. You can also click the Stop scan button at any time. |

|
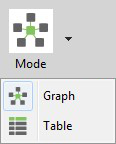
Graph view | Displays the modules as nodes in a graph. |

|
Table view | Displays the modules as rows in a table. |

|
Screenshot | Saves an image of the network to your computer. |

|
Export table | Exports network information in a tabular file format. |

|
Settings | Configures network-related parameters. |

|
Layout | Changes the network layout to one of six types: composite, spring, vertical tree, horizontal tree, grid (default), and radial. |

|
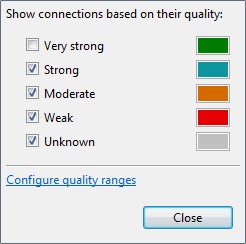
Filter links |
Hides or displays connections between RF modules based on their quality. Enables/disables quality ranges via radio buttons. All filters are enabled by default so all connections are visible. You can establish connection quality colors and ranges in Preferences > Network > Appearance or by clicking Configure quality ranges link in the Filter links dialog. |

|
Zoom | Changes the zoom level of the network. |

|
Find box | Searches for a particular module in the network. |
Network scan status
When you scan a radio module's network to find available modules, XCTU displays the status of the scan along the bottom edge of the Network working mode display.

| Field | Description |
|---|---|
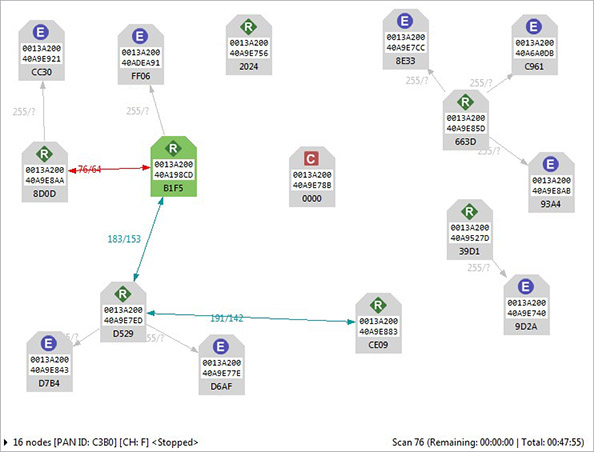
| 17 nodes | Number of nodes in the network |
| [PAN ID: BAB05A] | PAN ID |
| [CH: 11] | Channel |
| <Scanning> | Status: Getting information, Initializing scan, Scanning, Waiting for next scan, or Stopped |
| Scan 2 | Current scan number |
| Remaining: 00:00:21 | Estimated time remaining to finish current scan |
| Total: 00:00:39 | Total elapsed time of scan |
Graph view
In Graph view, XCTU displays the modules as nodes in a graph. A green background denotes the local radio module and a blue background denotes the selected module. Each module is labeled with its role (coordinator, router, or end device) and MAC address as well as the 16-bit network address for ZigBee networks and node identifier for other protocols. You can click any node to inspect its connections.
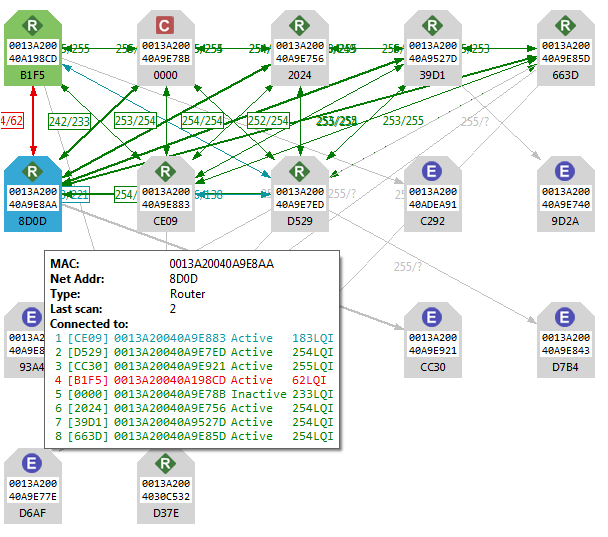
- Each node is connected to its neighbors with solid lines (active connections) or dotted lines (undiscovered connections), with arrows indicating the direction of communication. Selected nodes are blue, and connections are black. Nodes discovered in previous scans that have not been found in the current scan are delineated via lighter-colored lines; they will "turn on" as they are discovered.
-
When a radio module leaves the network, some devices continue to store information about their relationship. When you perform a new discovery, the module appears because of the preserved information but the device is unreachable if you attempt to verify the connection. These modules are shown in red.
- When you double click a node, XCTU switches to Configuration mode and displays the node's settings. If the node was not previously discovered, XCTU will add it to the device list as a remote node before displaying its settings.
Connection quality filters
You can filter connections by quality in Graph view to show/hide connections between modules according to configurable quality ranges.
Connections in 802.15.4, DigiMesh, and ZigBee
When viewing 802.15.4, DigiMesh, and ZigBee modules in Graph view, consider the following differences in node display:
| Protocol | Description and Node Display |
|---|---|
| 802.15.4 | XCTU does not display the quality of the connection between two nodes. The nodes displayed are in the RF range of the local radio module. |
| DigiMesh |
The quality of the connection between two nodes is displayed next to the line that connects them. Hover over the line joining the nodes to see bidirectional quality (in dB) and status of the connection, respectively.
|
| ZigBee |
The quality of the connection between two nodes is displayed next to the line that connects them. Hover over the line joining the nodes to see bidirectional quality and status of the connection, respectively. Link quality is represented by Link Quality Indication, or LQI, a number between 0 and 255 where 0 is the weakest and 255 is the strongest.
|
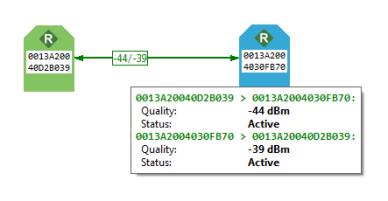
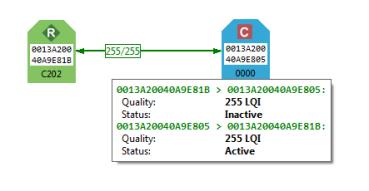
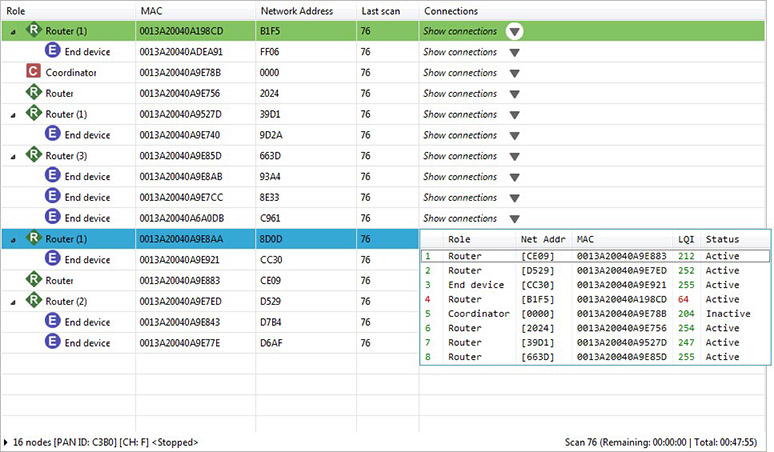
Table view
In Table view, network radio modules are displayed as rows in a table. ZigBee devices display end devices as children of their coordinators or routers. Other protocols display all nodes at the same level.
Nodes discovered in previous scans that have not been found in the current scan are delineated via italicized grey text. Connections not yet discovered are also displayed with grey text. A green background denotes the local radio module and a blue background denotes the selected module. When a radio module leaves the network, some devices continue to store information about their relationship. When you perform a new discovery, the module appears because of the preserved information but the device is unreachable if you attempt to verify the connection. These modules are shown in red.
| Field | Description |
|---|---|
| Role | Coordinator, router, or end device |
| MAC | 64-bit address of the module |
| Network address | Network address (ZigBee) / Node identifier (other protocols) |
| Last scan | Scan number when the device was last discovered |
| Connections |
Description of current module connections. Click Show connections to view a table with additional information about the module's connections. |
 PDF
PDF


