Device Availability

The Device Availability report provides a pie chart of the percentage of currently connected devices, and a line graph of connection percentage over time.

  1. From the main menu, click Insights > Reports.

  2. Click the Device Availability tab.

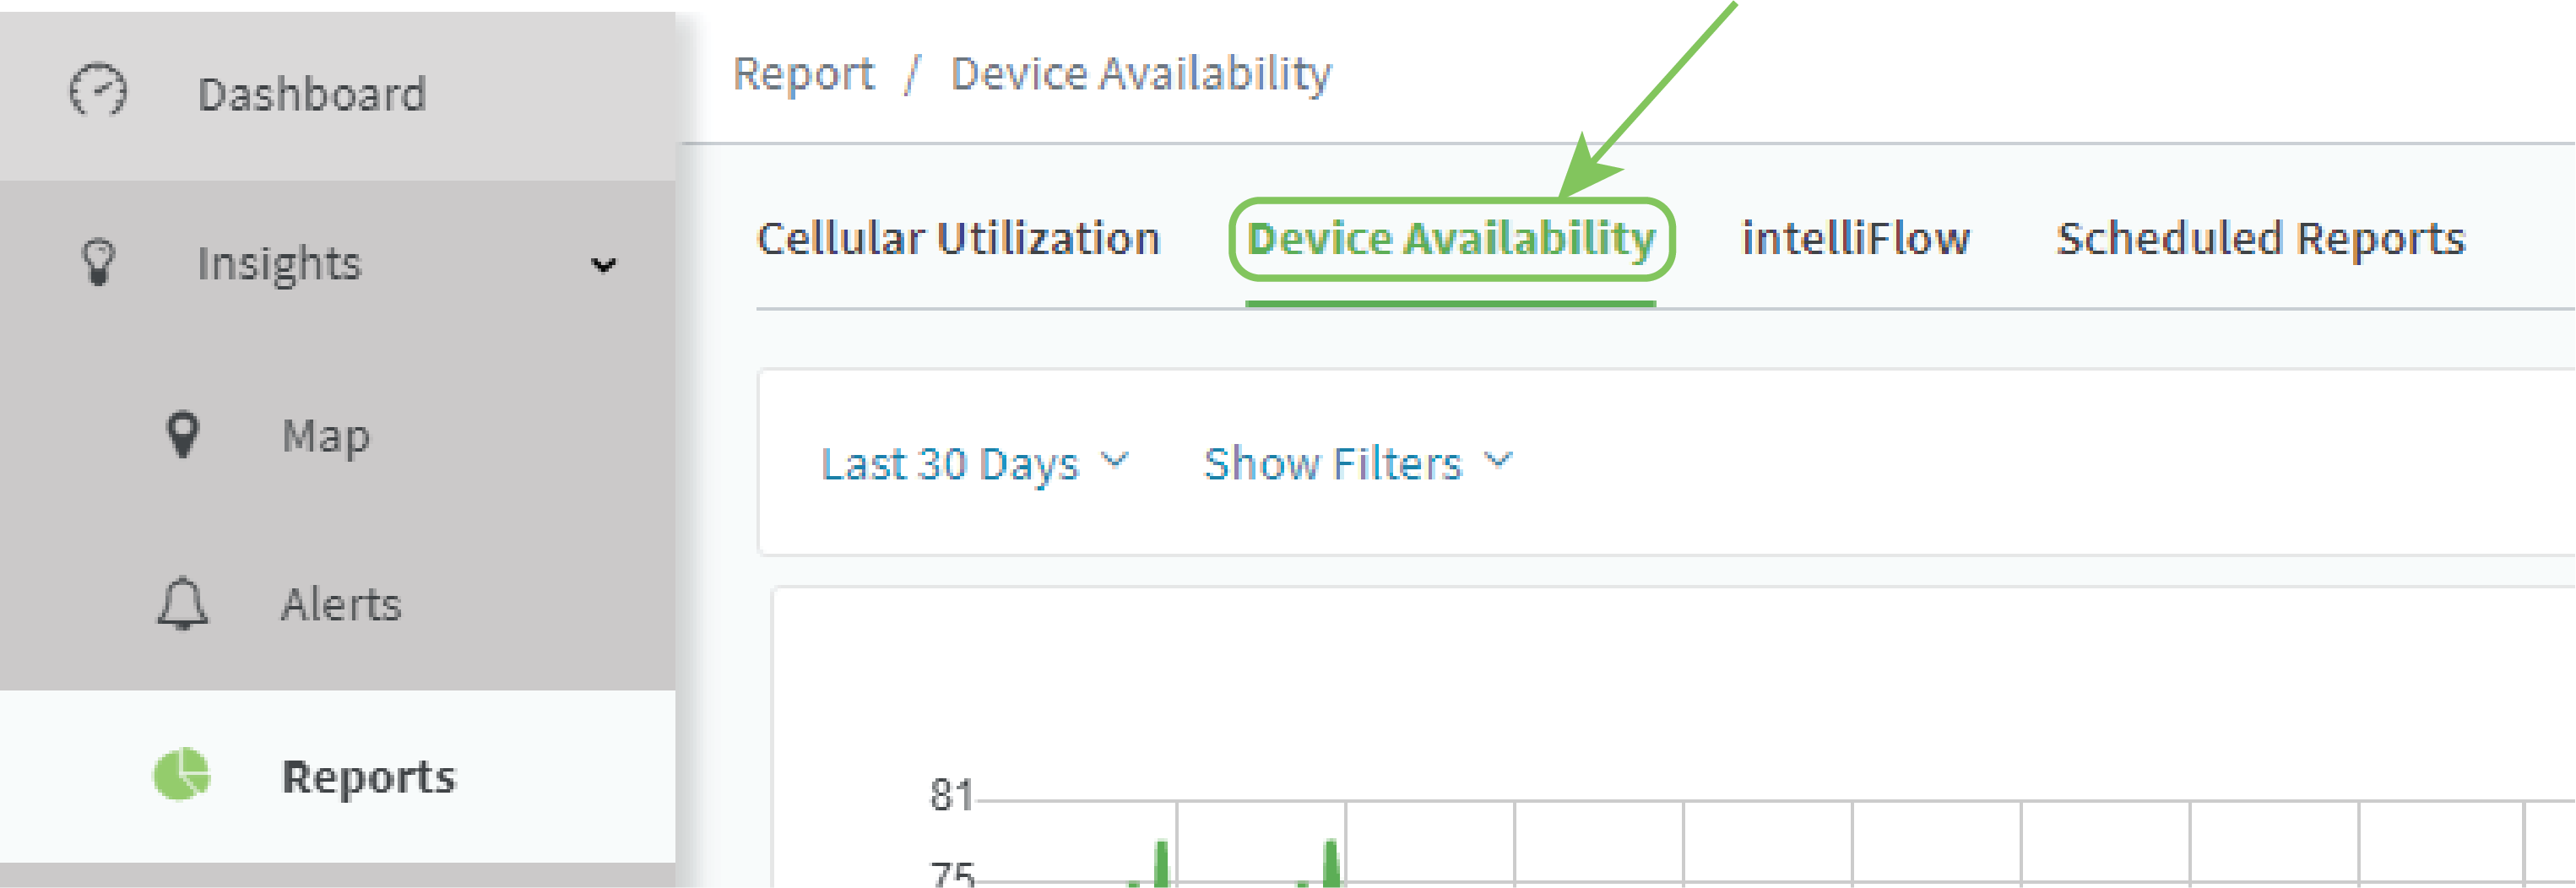
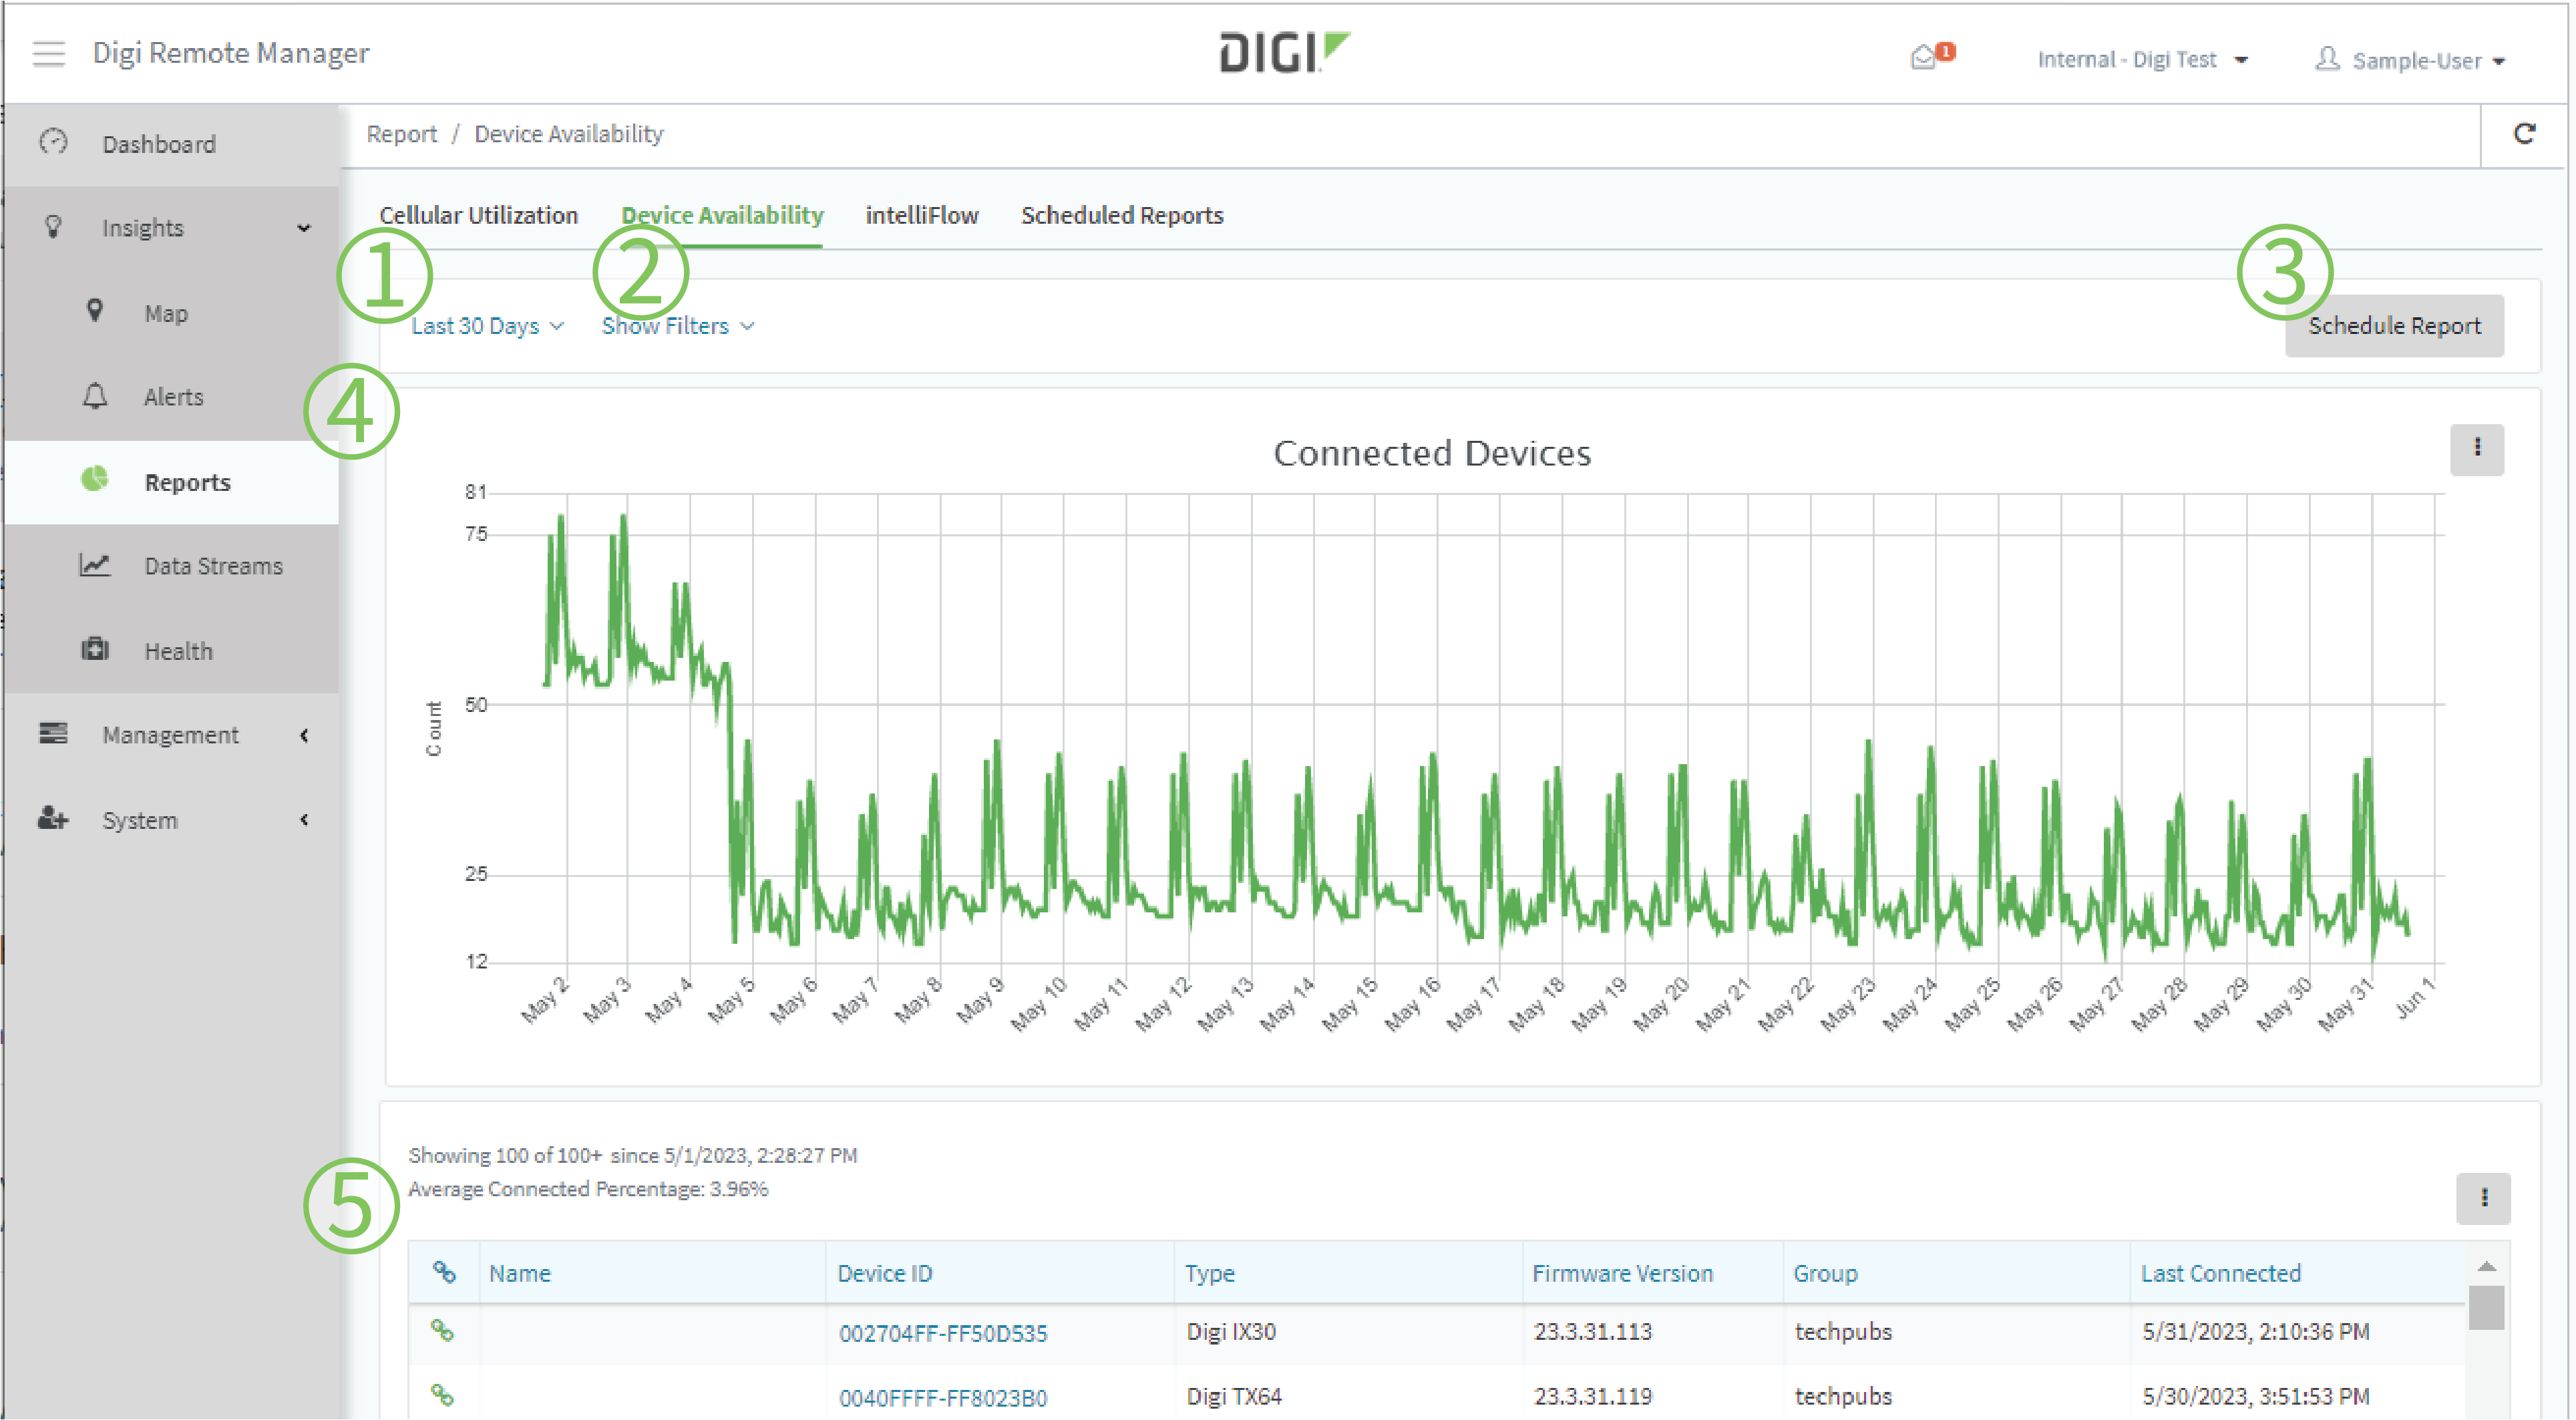
The Device Availability report page displays:

# Component Description
1 Date and time selector

Select a relative time, such as within the Last Hour or Last 30 Days. Or, enter a Start and End date.

2 Filters
  1. Click to expand Show Filters .

  2. Type or select values for the appropriate filters.

  3. Click Generate Report when finished.

3 Schedule Report Click Schedule Report to open the Scheduled Report Options dialog.
3 Connected Devices graph

Line graph that displays connection statistics for all matching devices.


Click next to the graph to:

  • Download a copy of the chart in PNG, JPEG, or SVG format.

  • Set the Unit to display either the total Count or the Percentage of connected devices.

4 Device availability tabular view

Displays device availability in tabular form.

Click to customize the display.

  • Click Select Columns to open a list of columns.

    • Click to select the columns that will be displayed in the device list.

    • Click and select whether to send the column to the top or bottom of the list.

    • Click to reorder the listing by dragging and dropping a column.

    • Click Use Defaults to return to the default display.

    • Click Close when finished.

  • Click Table Preferences to set your table view preferences:

    • Click Table Spacing to select Compact, Comfy, or Roomy spacing.

    • Click Device ID to determine how to display the Device ID, either Friendly (shorter) or Full. (This table preference is not applicable for the Configurations table.)