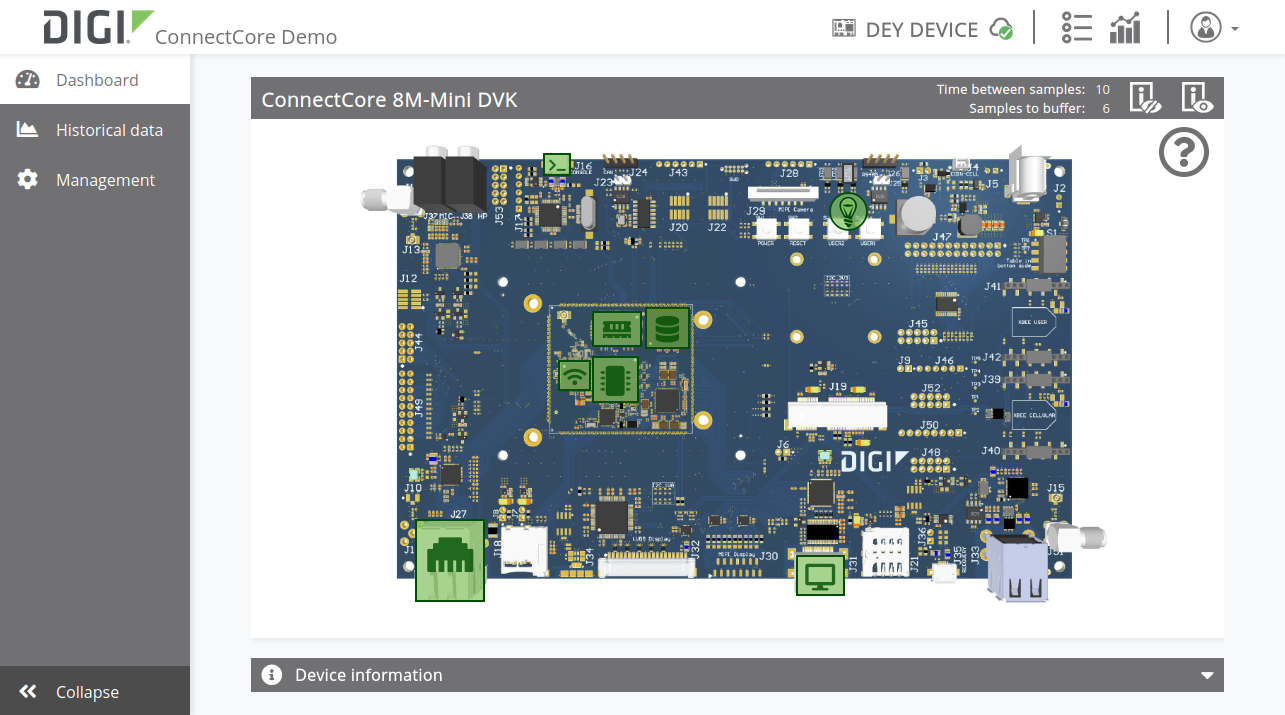
The Dashboard page displays a graphical representation of the ConnectCore device with a set of clickable elements to explore and control some of the device interfaces.
You can access the Dashboard page in two ways:
-
It is displayed by default after you select the device in the web application front end.
-
Click Dashboard on the left navigation bar.
| The application display is specific to the ConnectCore platform, so your screen may look different than the one shown here. |
From the dashboard, you can:
-
Monitor device health information and interface status by clicking on the green panels.
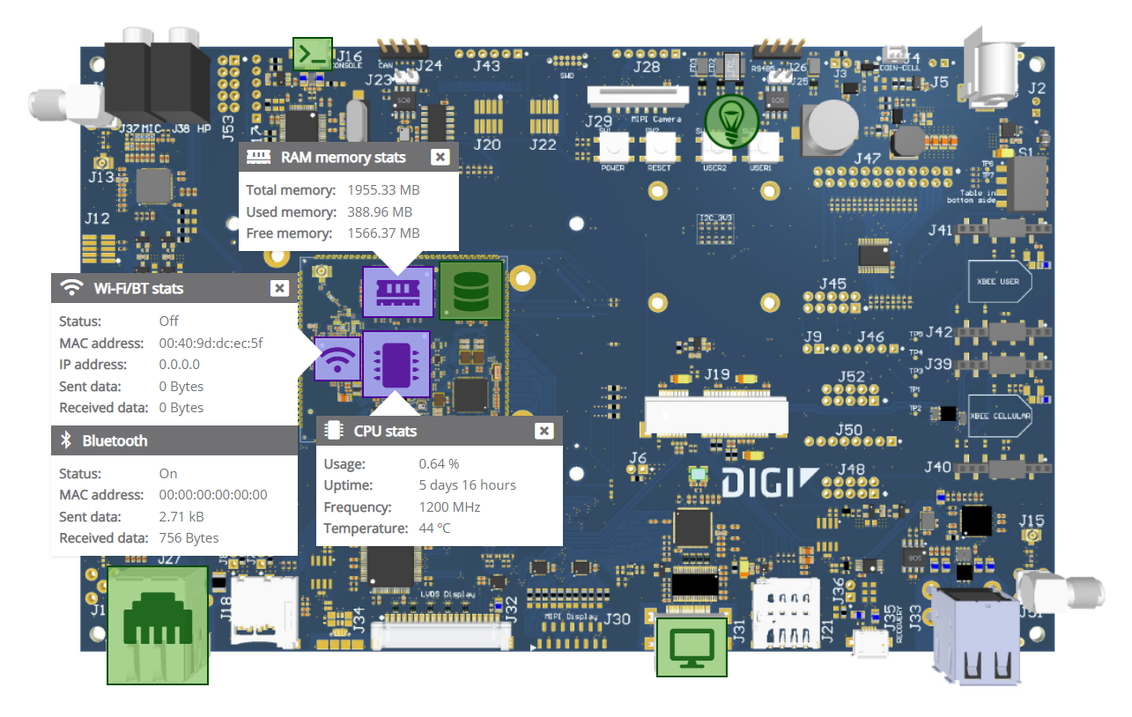
See Monitor the system to check uploaded device data in Digi Remote Manager. -
Get device versioning information by expanding the Device information panel at the bottom of the page:
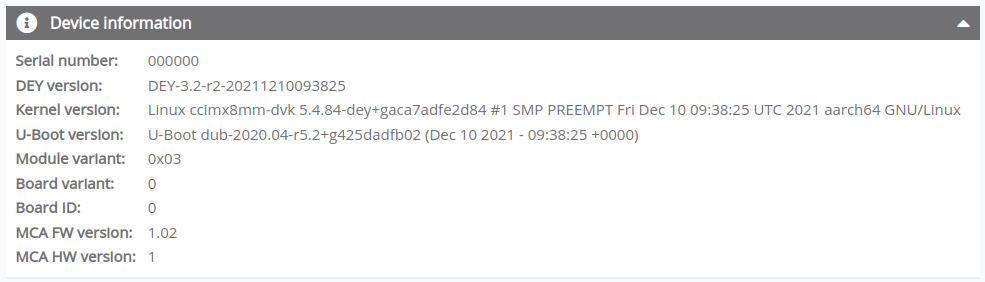
See Get device information to review device information in Digi Remote Manager. -
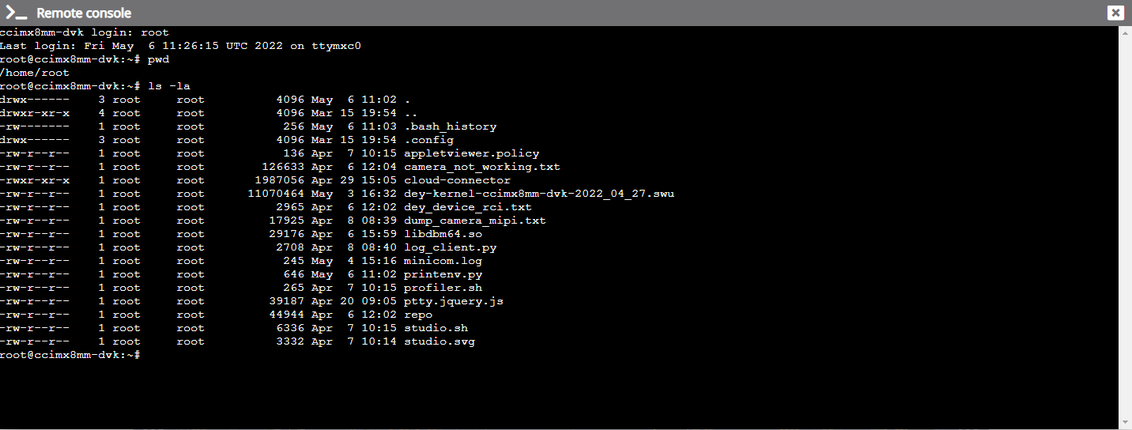
Open a shell console session by clicking the green Console panel button:

-
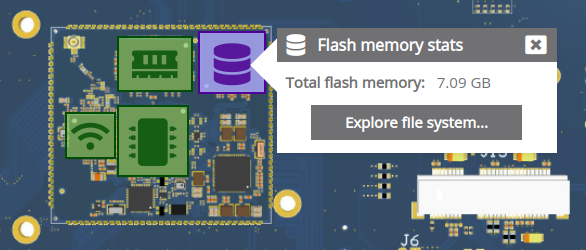
Explore the device file system by clicking Explore file system in the Flash memory stats panel:
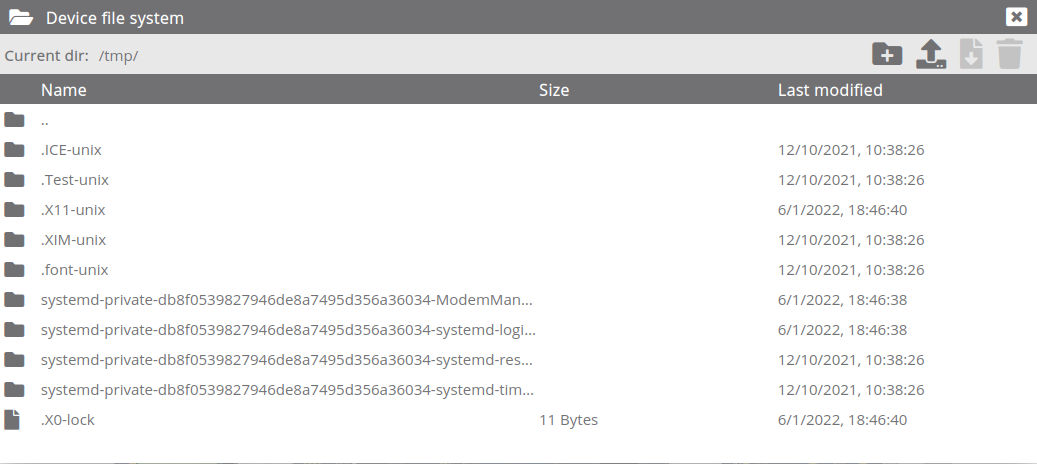
The file system explorer allows you to:
-
List files and folders in the current directory.
-
Navigate through the file system.
-
Download the selected file.
-
Remove the selected file.
-
Upload a new file.
-
Create a new directory.
See Access the file system to access the device file system from Digi Remote Manager. -
-
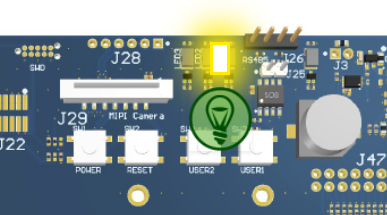
Toggle the User LED status by clicking the green LED button: