Visual Studio Code (VS Code) is a modern source-code editor you can use to program and debug applications on embedded platforms.
Configure your host machine
Install the list of required packages:
$ sudo apt-get -y update
$ sudo apt-get -y install build-essential gdb gdb-multiarch| This is the list of required packages for Ubuntu Linux. |
Configure your target
Digi’s precompiled images include all the tools necessary to debug and launch applications in your target.
Install VS Code and VS Code extension
If you don’t have VS Code installed on your computer, you can install it with the following command:
$ sudo snap install --classic codeThe cpptools extension allows you to compile and debug in VS Code.
Install it with:
$ code --install-extension ms-vscode.cpptoolsGPIO example
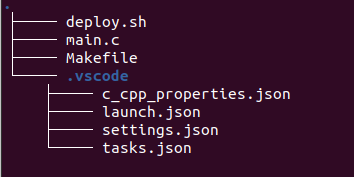
Download and extract the zip file containing the apix-gpio example from https://ftp1.digi.com/support/digiembeddedyocto/vscode/GPIO-EXAMPLE.zip. The directory has the following structure:

Prepare the example
Edit the settings.json file containing the configuration to compile and debug the example with your target settings.
Add the IP of your device and the path where the toolchain is installed on your host computer.
"TARGET_IP":"10.101.2.153",
"DEBUG_PORT":"6666",
"BINARY":"main",
"SDK_DIR":"~/opt/dey/{os-version}-{os-release}/{pfm-codename-pro}/sysroots/{toolchain-name}",
"C_Cpp.errorSquiggles":"disabled",
Run the example
-
Make sure you have configured the correct IP of your target and it is connected to the network.
By default, the Get Started with ConnectCore Cloud Services demo application seizes the user button. To use the example, stop the
cccs-gs-demowith the following command:# systemctl stop cccs-gs-demo -
Open Visual Studio Code in the extracted folder and open the
main.cfile: -
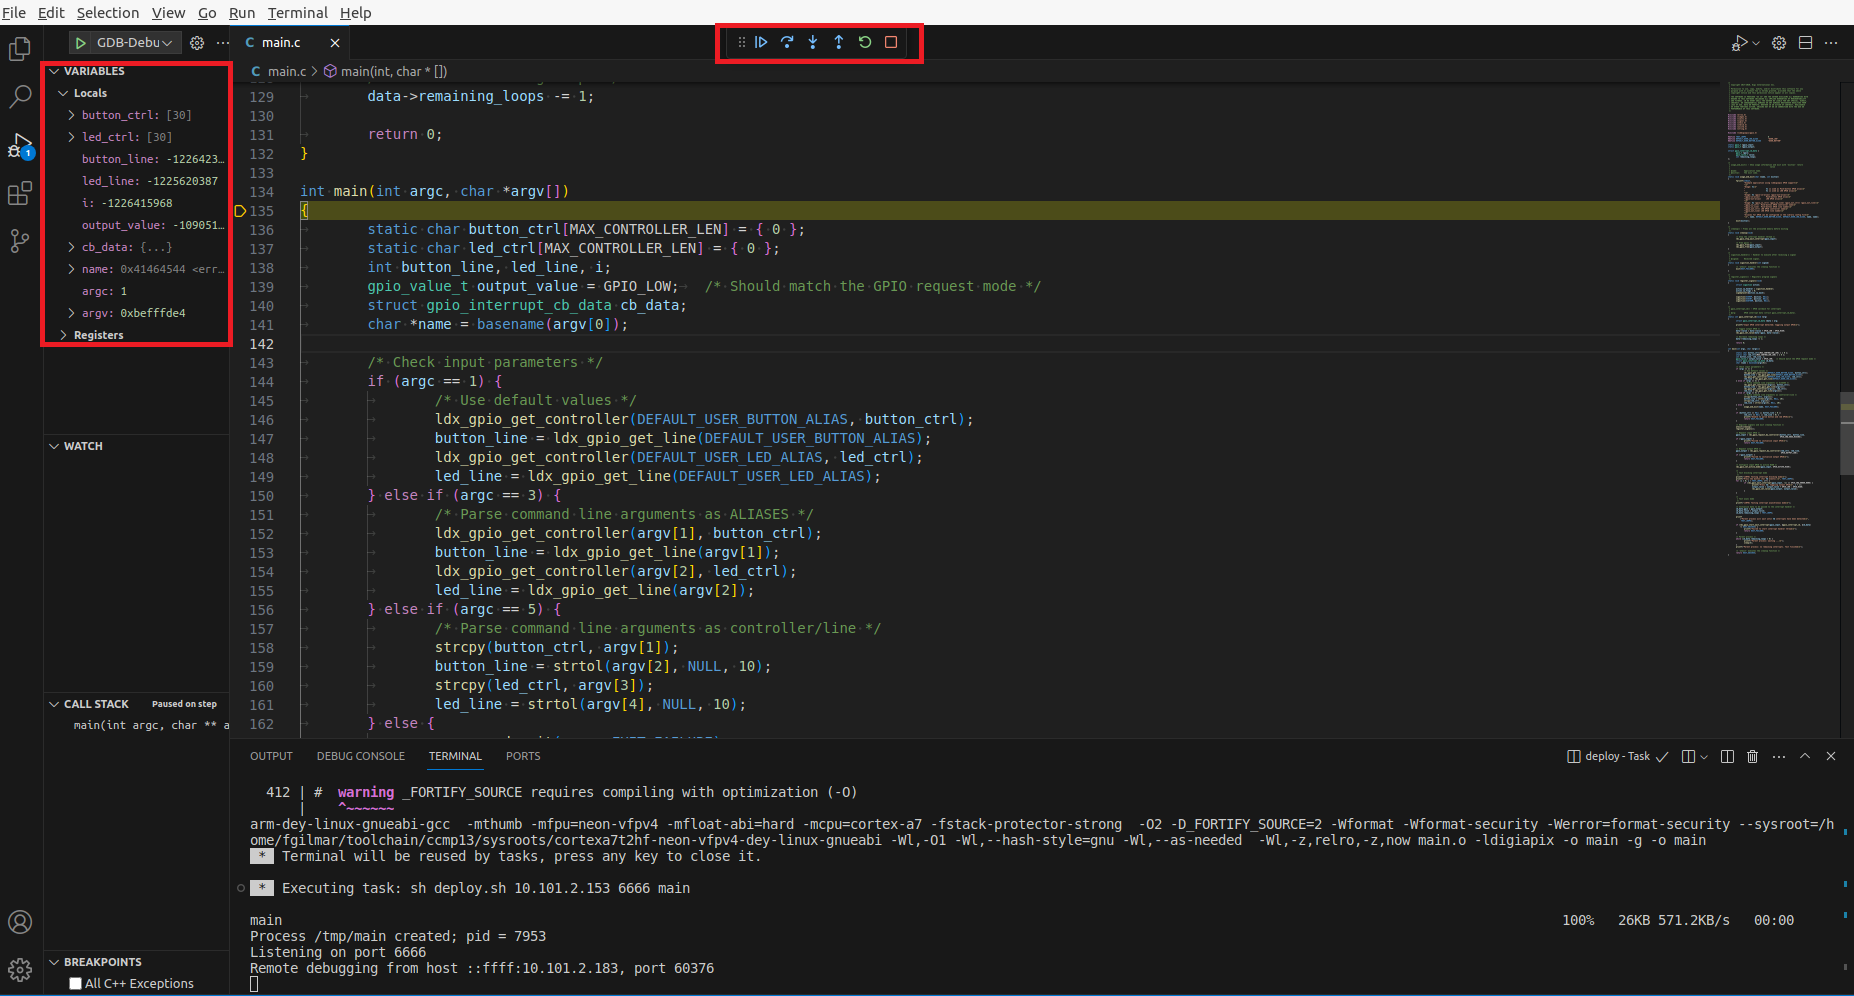
Click Run > Start Debugging, or press F5, to start remotely debugging the application.

Check the status of your variables and add a watcher to different variables and expressions in the left panel. You can add breakpoints by clicking in the space between the line numbers and the side panel. To continue executing the program, press F5 or click the continue button in the top toolbar.
| You can also press Ctrl+F5 to launch the application. |


